| Item | Details |
|---|---|
| Title of the article | Bank of England cuts rates from 16-year high, ‘careful’ on future moves |
| Source of the article | Reuters, by David Milliken, Andy Bruce and Suban Abdulla |
| Date the article was published | August 1, 2024 |
| Date the commentary was written | August 28, 2024 |
| Word count | 792 words |
| Unit of the syllabus | Unit 3: Macroeconomics |
| Key concept | Economic well-being |
Commentary
The Article and Key Terms
On August 1, 2024, the Bank of England’s Monetary Policy Committee (MPC) cut Bank Rate by 0.25 percentage points, from 5.25% to 5%. It was the first cut since March 2020 and passed by five votes to four, as policymakers disagreed about whether inflationary pressure had eased enough (Milliken et al., 2024). Bank Rate is the interest rate the Bank pays commercial banks on the money they hold with it, so it sets the base for the rates that households and firms pay on loans and earn on savings. Changing it is monetary policy, which works through aggregate demand (AD), the total planned spending on an economy’s goods and services. The Bank targets inflation, the rate at which the average price level rises, of 2%. Inflation had fallen from a 41-year high of 11.1% in October 2022 to 2% in May and June 2024. This commentary uses the key concept of economic well-being to judge whether the cut is likely to leave people in the UK better off.
- CPI inflation, 12-month ratePeaked at 11.1% in October 2022 and was back at 2.0% in May 2024.
- Bank Rate, end of monthRaised 14 times from 0.1% to 5.25% between December 2021 and August 2023, then cut to 5% on August 1, 2024.
- Inflation target, 2%
Per cent
CPI is the 12-month change in the Consumer Prices Index for each month, published by the Office for National Statistics in the middle of the next month. Bank Rate is the rate in force at the end of each month; in March 2020 it was cut twice, from 0.75% to 0.1%.
Chart by Writers Per Hour from the Bank of England’s Bank Rate history and the Office for National Statistics’ CPI annual rate, series D7G7 (Open Government Licence v3.0), checked on November 13, 2026.
Show every figure as a table
| Month | CPI inflation, 12-month rate | Bank Rate, end of month |
|---|---|---|
| Jan 2020 | 1.8 | 0.75 |
| Feb 2020 | 1.7 | 0.75 |
| Mar 2020 | 1.5 | 0.10 |
| Apr 2020 | 0.8 | 0.10 |
| May 2020 | 0.5 | 0.10 |
| Jun 2020 | 0.6 | 0.10 |
| Jul 2020 | 1.0 | 0.10 |
| Aug 2020 | 0.2 | 0.10 |
| Sep 2020 | 0.5 | 0.10 |
| Oct 2020 | 0.7 | 0.10 |
| Nov 2020 | 0.3 | 0.10 |
| Dec 2020 | 0.6 | 0.10 |
| Jan 2021 | 0.7 | 0.10 |
| Feb 2021 | 0.4 | 0.10 |
| Mar 2021 | 0.7 | 0.10 |
| Apr 2021 | 1.5 | 0.10 |
| May 2021 | 2.1 | 0.10 |
| Jun 2021 | 2.5 | 0.10 |
| Jul 2021 | 2.0 | 0.10 |
| Aug 2021 | 3.2 | 0.10 |
| Sep 2021 | 3.1 | 0.10 |
| Oct 2021 | 4.2 | 0.10 |
| Nov 2021 | 5.1 | 0.10 |
| Dec 2021 | 5.4 | 0.25 |
| Jan 2022 | 5.5 | 0.25 |
| Feb 2022 | 6.2 | 0.50 |
| Mar 2022 | 7.0 | 0.75 |
| Apr 2022 | 9.0 | 0.75 |
| May 2022 | 9.1 | 1.00 |
| Jun 2022 | 9.4 | 1.25 |
| Jul 2022 | 10.1 | 1.25 |
| Aug 2022 | 9.9 | 1.75 |
| Sep 2022 | 10.1 | 2.25 |
| Oct 2022 | 11.1 | 2.25 |
| Nov 2022 | 10.7 | 3.00 |
| Dec 2022 | 10.5 | 3.50 |
| Jan 2023 | 10.1 | 3.50 |
| Feb 2023 | 10.4 | 4.00 |
| Mar 2023 | 10.1 | 4.25 |
| Apr 2023 | 8.7 | 4.25 |
| May 2023 | 8.7 | 4.50 |
| Jun 2023 | 7.9 | 5.00 |
| Jul 2023 | 6.8 | 5.00 |
| Aug 2023 | 6.7 | 5.25 |
| Sep 2023 | 6.7 | 5.25 |
| Oct 2023 | 4.6 | 5.25 |
| Nov 2023 | 3.9 | 5.25 |
| Dec 2023 | 4.0 | 5.25 |
| Jan 2024 | 4.0 | 5.25 |
| Feb 2024 | 3.4 | 5.25 |
| Mar 2024 | 3.2 | 5.25 |
| Apr 2024 | 2.3 | 5.25 |
| May 2024 | 2.0 | 5.25 |
| Jun 2024 | 2.0 | 5.25 |
| Jul 2024 | 2.2 | 5.25 |
| Aug 2024 | 2.2 | 5.00 |
Why Interest Rates Rose
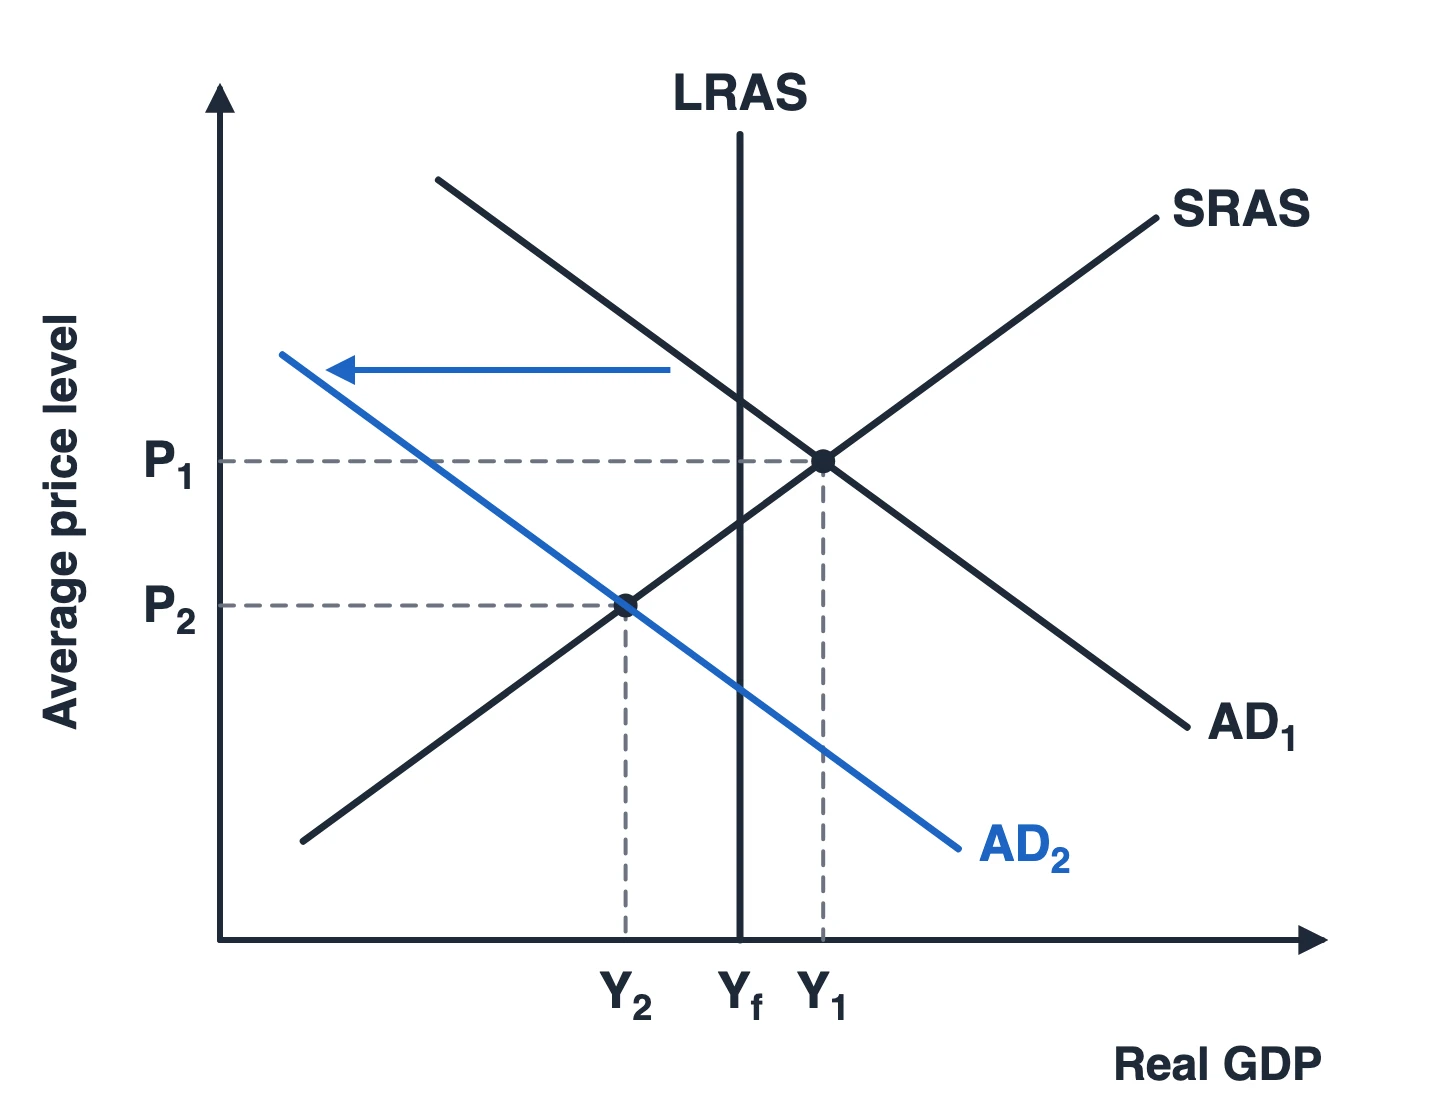
The cut ends a long period of contractionary monetary policy. After the pandemic, spending recovered faster than supply, and energy prices rose sharply in 2022, so inflation climbed far above target. Between December 2021 and August 2023 the MPC raised Bank Rate 14 times, from 0.1% to 5.25%. Higher interest rates raise the cost of borrowing and the reward for saving, so consumption and investment, two components of AD, fall. In Figure 1, AD shifts left from to . Real GDP falls from to , and the average price level falls from to ; in practice prices rise more slowly, so inflation falls. The cost is that output is now below its full-employment level (), a negative output gap, and unemployment tends to rise.
Effects of the Rate Cut
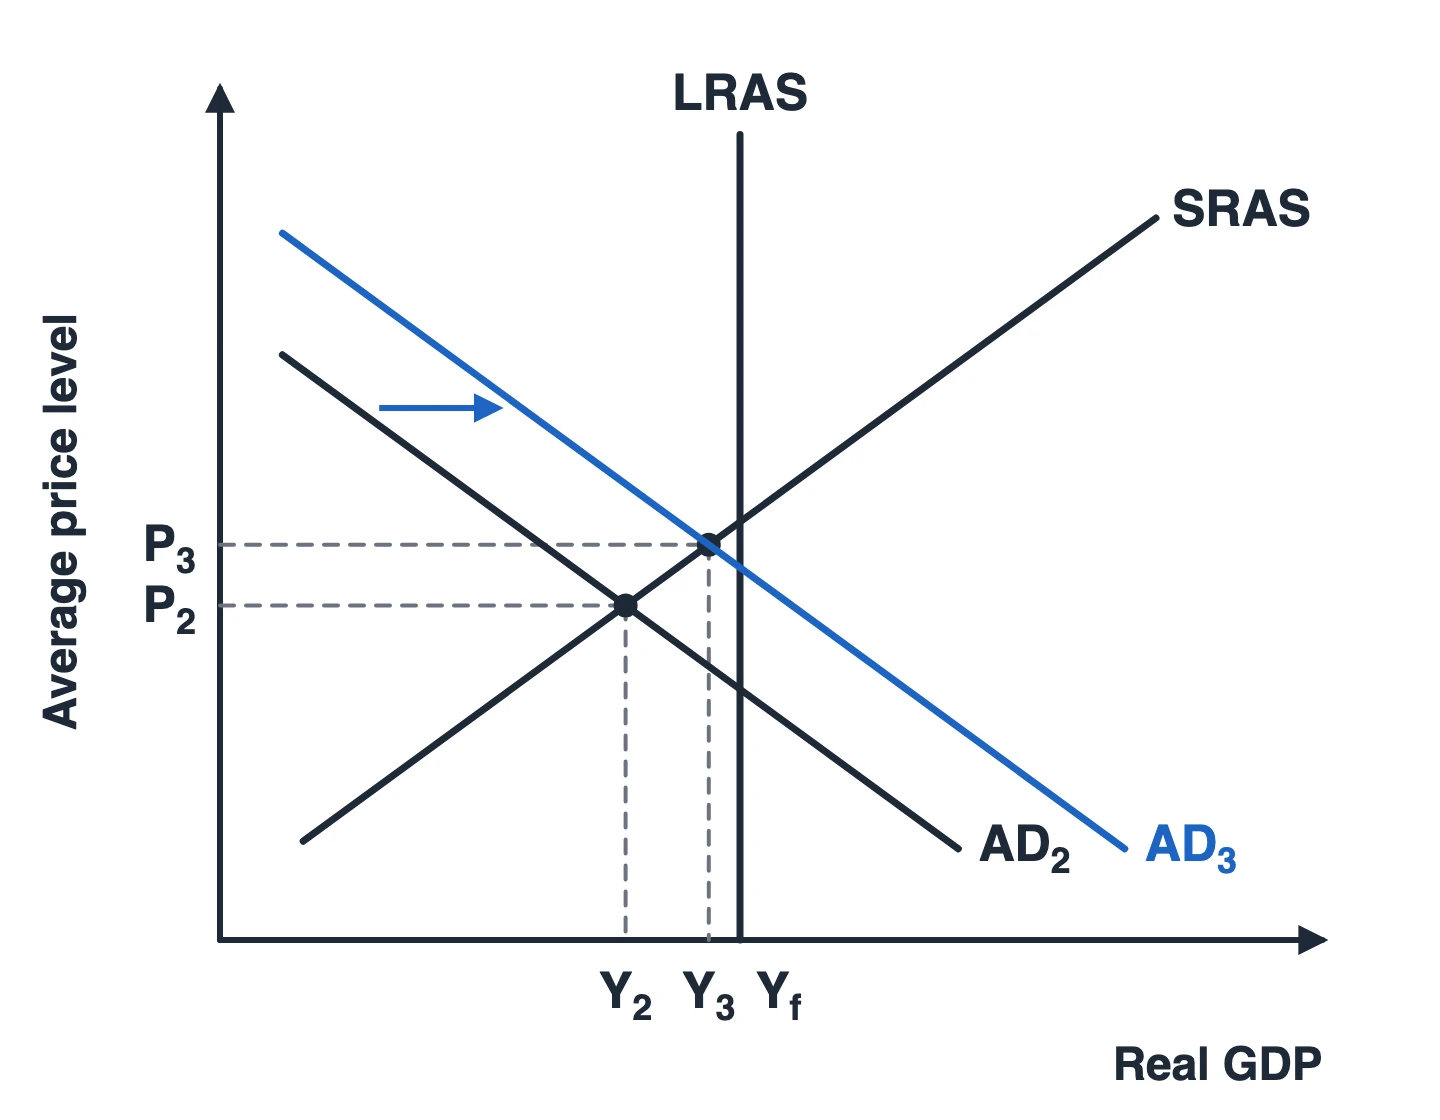
Cutting Bank Rate is an expansionary move, although at 5% policy is still restrictive. Banks pass the lower rate on to variable-rate mortgages and new loans, so households have more disposable income and firms find more investment projects worthwhile, while saving becomes less attractive. In Figure 2, AD shifts right from to : real GDP rises from to , closer to , while the price level rises only a little, from to , because the economy has spare capacity. The multiplier makes the effect larger: extra spending becomes income for other firms and workers, who spend part of it again, so national income rises by more than the first increase in spending.
Economic Well-Being
Economic well-being refers to people’s prosperity, economic security and quality of life. The cut can raise it in three ways. Borrowers, especially mortgage holders whose repayments rose sharply in 2022 and 2023, keep more of their income. Firms that invest create jobs, which limits the rise in unemployment that the Bank expects. Low and stable inflation also protects real incomes, which fell in 2022 when prices rose faster than wages; by cutting only slightly, the Bank supports spending without putting that at risk. Not everyone gains, however: savers and retired people who live on interest income lose, so the policy redistributes income from savers to borrowers.
Evaluation
Several factors limit the effect of the cut. First, monetary policy works with long time lags: the Bank of England (n.d.) says it can take around 18 to 24 months to have its full effect, and households on fixed-rate mortgages will feel the cut only when their deal ends. Second, a quarter-point cut is small, and households and firms that lack confidence may save rather than spend. Third, the four members who voted against feared that inflation would prove persistent: services inflation was 5.7% and private-sector pay growth 5.6% (Bank of England, 2024). If the Bank cuts too fast, inflation could rise again and erode the gains in well-being. Finally, lower interest rates can push up house prices and household debt, and supply shocks such as higher energy prices are beyond the Bank’s control. Monetary policy may therefore need support from supply-side policies that raise productivity and shift LRAS to the right, allowing growth without inflation.
Conclusion
In conclusion, the August 2024 cut is a cautious first step away from contractionary policy. With inflation back at target and unemployment expected to rise, a small cut is likely to raise economic well-being by lowering borrowing costs and supporting jobs, but the gains will be gradual and uneven. The narrow vote and Governor Andrew Bailey’s warning that the Bank must not cut rates “too quickly or by too much” (Milliken et al., 2024) show why it is right to move slowly: a return of high inflation would harm well-being more than a few more months of high interest rates.