Introduction
Biomes are large-scale ecosystems which can be classified by their climatic conditions, soil types and dominant plant species. Tropical rainforest and tundra are at opposite ends of the temperature scale globally and so provide a comparison of the effect of temperature and water availability on life on land. This report will compare the climatic conditions and soil types, productivity and biodiversity, and susceptibility to climate change of tropical rainforest and tundra.
Climate and Soil
One of the biggest differences between the two biomes is the temperature. Rainforest areas are always warm throughout the year. The monthly average temperature in the rainforest areas in South America ranged from 23.5 °C to 26.4 °C between 2001 and 2019. Monthly rainfall varied between around 91 mm and 266 mm (Márquez Arévalo et al. 2023, p. 11). Therefore, there is no period of cold in this biome.
Tundra is extremely cold. The average air temperature at the tundra and forest-tundra areas in Siberia was around −10 °C to −12 °C annually. During the coldest months this dropped to around −32 °C to −34 °C. During the summer months the temperature only rose to an average of +11 °C to +14 °C. Permafrost (permanently frozen ground) can be found up to 1400 m deep. Only the top part of the ground is defrosted during the summer (Kharuk et al. 2025, p. 3).
- Average temperature of the month (°C, left scale)
Manaus, Brazil
Amazon rainforest, 3.1° S, 61 m above sea level. Every month averages between 26.6 °C and 28.6 °C. 2,362 mm of precipitation a year, from 56 mm in August to 331 mm in April.
Khatanga, Russia
Taymyr Peninsula, 72.0° N, 31 m above sea level. Eight months average below freezing, from −31.6 °C in February to 13.2 °C in July. 281 mm of precipitation a year, never more than 44 mm in a month.
These are climate averages for one place each, so they do not match the paper’s ranges exactly. The paper’s 23.5 to 26.4 °C and 91 to 266 mm are values for the whole South American rainforest biome; a single lowland city such as Manaus runs warmer, and its wettest and driest months are further apart, than that average. Khatanga lies about 55 km from the Ary-Mas site in Kharuk et al. (2025), which reports similar figures: −12 °C a year, 250 mm of precipitation, +12 °C in July and −32 °C in the coldest months.
Chart by Writers Per Hour. Manaus: Instituto Nacional de Meteorologia (INMET), Normal Climatológica do Brasil 1991–2020, station 82331 (compensated mean temperature and accumulated precipitation). Khatanga: NOAA National Centers for Environmental Information, Global Summary of the Month, station RSM00020891 (WMO 20891), averaged by the site over 1991–2020 (28 to 30 values for each month; the station has gaps in 2019 and 2020). The paper does not cite these figures.
Show the monthly figures
| Month | Manaus, Brazil | Khatanga, Russia | ||
|---|---|---|---|---|
| Temperature (°C) | Precipitation (mm) | Temperature (°C) | Precipitation (mm) | |
| January | 26.6 | 305.6 | −31.0 | 17.0 |
| February | 26.6 | 296.8 | −31.6 | 12.8 |
| March | 26.6 | 320.9 | −24.5 | 12.7 |
| April | 26.7 | 331.0 | −15.5 | 12.6 |
| May | 27.0 | 233.3 | −5.1 | 15.5 |
| June | 27.3 | 117.2 | 7.6 | 27.7 |
| July | 27.5 | 67.1 | 13.2 | 41.6 |
| August | 28.2 | 56.1 | 9.9 | 43.7 |
| September | 28.6 | 79.0 | 2.4 | 30.7 |
| October | 28.5 | 113.9 | −11.1 | 28.7 |
| November | 28.0 | 188.0 | −23.9 | 22.1 |
| December | 27.2 | 253.5 | −29.1 | 16.1 |
| Year | 27.4 | 2,362 | −11.6 | 281 |
Both biomes have poor soil. Tundra soils are usually infertile and moist (Kharuk et al. 2025, p. 3). Most of the minerals available in the soil of the Amazon come from vegetation as nutrients are passed back into the soil as litter and recycled. This means the rainforest soils are not very fertile (Márquez Arévalo et al. 2023, p. 19). Some parts in the rainforest have infertile soils, such as sandy Espodossolos soils which also do not hold much water (Márquez Arévalo et al. 2023, p. 20).
Productivity and Biodiversity
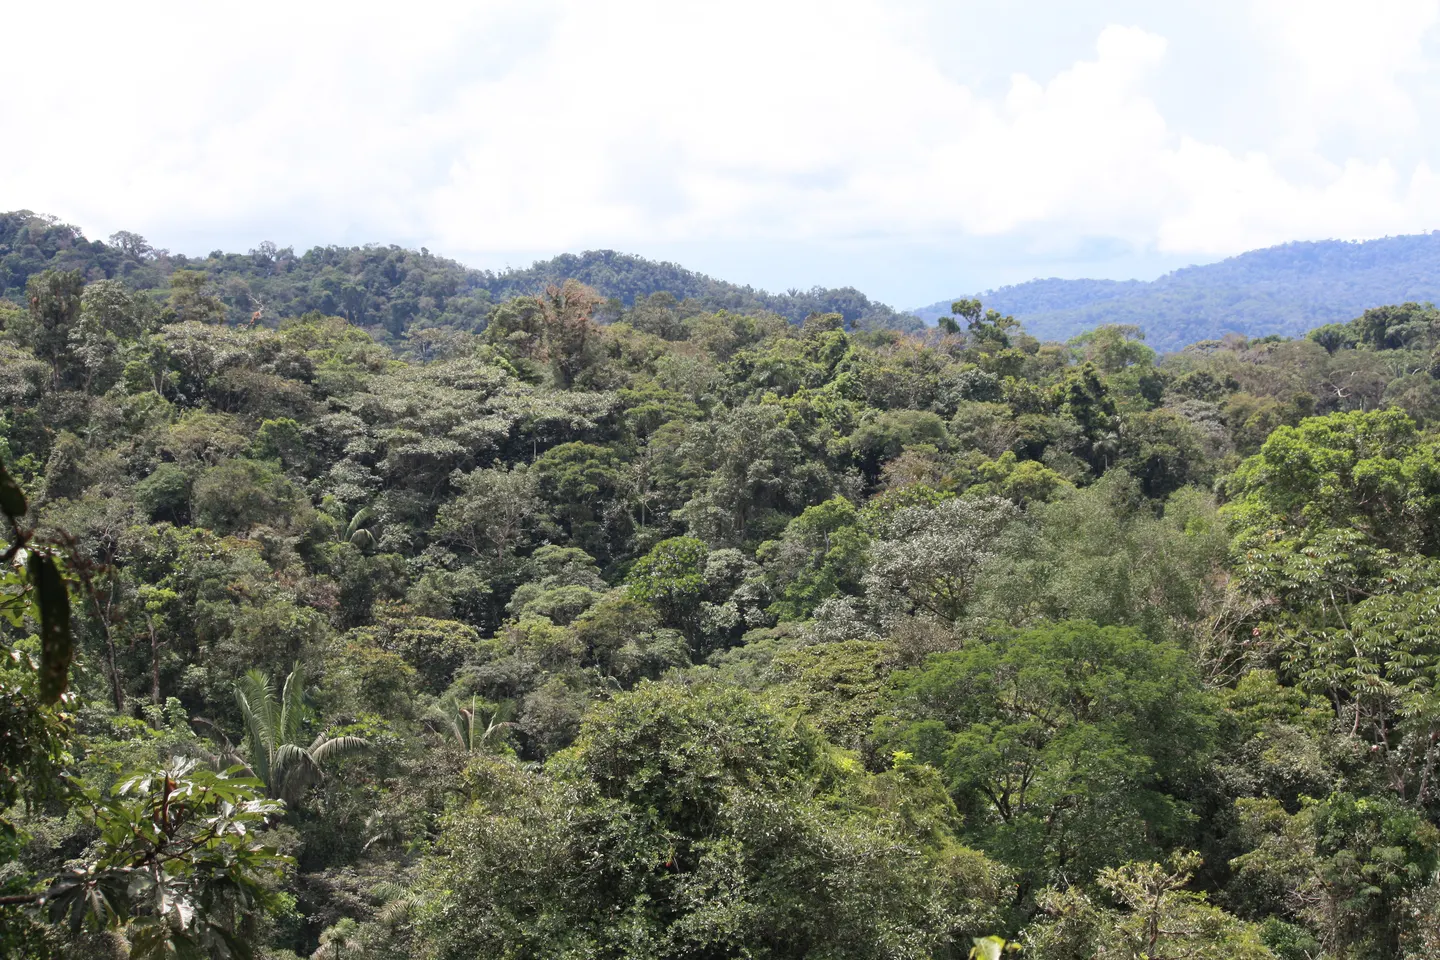
Biodiversity and carbon stock in the rainforest depend highly on the intensity of use. The Mayombe forest in the Democratic Republic of Congo had a high level of biodiversity with 92 tree species in the low intensity areas. In the moderate intensity areas, there were 59 tree species and only 20 tree species in the high intensity areas (Michel et al. 2022, p. 9). Carbon stock above ground was around 2.7 times higher in the 10-year-old plots in the moderate intensity areas than in the high intensity areas. Carbon stock was also around twice as high in the 20-year-old plots (Michel et al. 2022, p. 11). The rainforest has a high level of biodiversity and so also a high level of carbon.
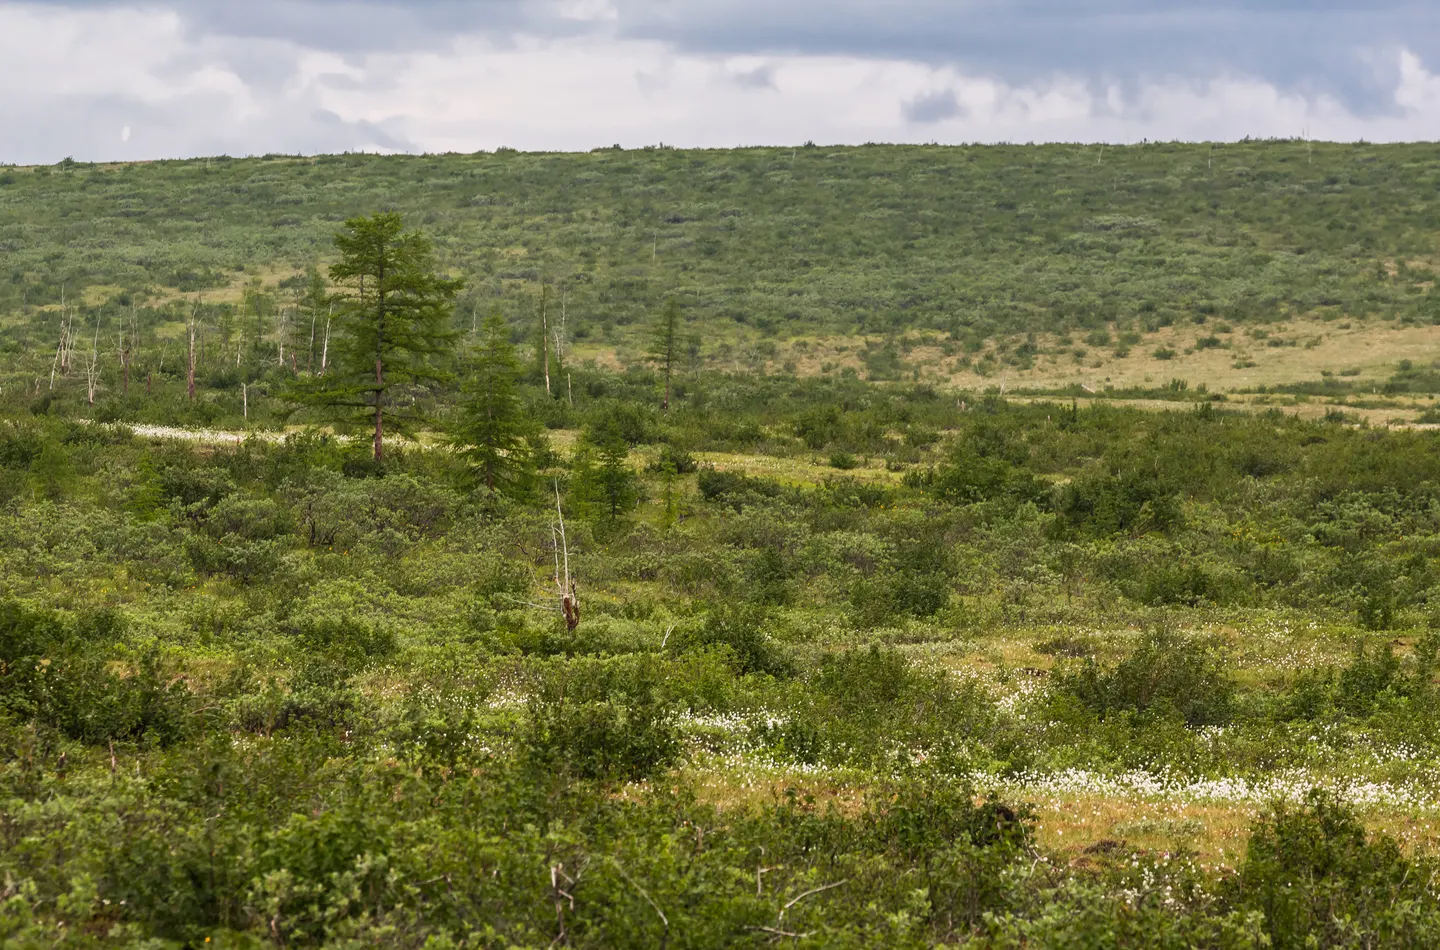
Tundra areas have a low level of plant diversity. The areas studied in Siberia had willow, birch, sedges, mosses and lichen. There were few larch trees in the forest-tundra areas (Kharuk et al. 2025, p. 4). Snow was stable from around late September to early June, so there isn’t a long growing season (Kharuk et al. 2025, p. 3). The cold and moist soil also limits plant growth. However, soil water content was negatively related and air and soil temperature were positively related to the NPP (carbon fixed by the plants after respiration) (Kharuk et al. 2025, p. 1). The temperatures in the rainforest are higher with a minimum monthly average of 23.5 °C (Márquez Arévalo et al. 2023, p. 11). In the tundra, plants must grow rapidly in the few months available after the warming up.
Climate Change and Carbon
Both biomes are under pressure; however, they have different issues. In the Arctic area of Siberia, temperatures are increasing around 4 times faster than areas further south and the permafrost is melting (Kharuk et al. 2025, p. 2). Surprisingly, this has created good growing conditions. The soil water content decreased according to satellite data. The soil is warmer and drier so promotes plant growth and helps keep the Arctic as a carbon sink despite more burning (Kharuk et al. 2025, p. 1). As this research is only looking at one area of the tundra, other areas may react differently.
The rainforest is under threat from climate change. Temperatures are projected to increase in all months and soil water content to decrease the most between June and August (Márquez Arévalo et al. 2023, p. 14). There is also a negative correlation between soil moisture and fire (r = −0.655) so there were more fires when the soil was drier (Márquez Arévalo et al. 2023, p. 17). The land use also causes damage. The high intensity areas in Mayombe had between a quarter and a half of the carbon stock of the moderate intensity areas (Michel et al. 2022, p. 11). The main issue for the tundra is the warming of the frozen ground. The main issue for the rainforest is that it is becoming drier and being disturbed by humans.
Conclusion
The tropical rainforest and tundra have very different temperatures, growing seasons and soil water content but are both susceptible to changes in temperature and water. The tropical rainforest is warm and moist all year round and has a high level of tree species and carbon in low intensity areas. However, it is at risk from becoming drier, from fires and from high intensity land use. The tundra is very cold underground and has a low level of plant life. However, one large study in Siberia shows the permafrost melting is helping promote plant growth. This research is only based on three studies from specific areas so more research should be done to get a clearer picture of how they are affected globally.