Abstract
Urban air pollution is one of the major environmental health problems of the 21st century. This research study covers the major sources of urban air pollution from combustion of fossil fuels in transport, industry and power generation, and describes the health effects of air pollution based on global estimates published in 2021 and 2024. It also examines solutions that can be put into practice: air quality standards, clean energy, the public transport system, electrification of the transportation system and urban green infrastructure. Most of the populations across the world are exposed to polluted air. However, concerted action through policy and technology has significant potential to decrease the exposure and avoidable mortality associated with pollution.
Keywords: Fine particulate matter (PM₂.₅), fossil fuel combustion, public health, renewable energy
Introduction
Cities are central places of human activity, vehicles, factories, and energy consumption, making them hotspots of air pollution. The most significant pollutant is fine particulate matter (PM₂.₅), particles 2.5 micrometers or less in diameter that can get deep into the lungs and enter the bloodstream (World Health Organization [WHO], 2022). Other dangerous pollutants are the gases nitrogen dioxide, ozone, sulphur dioxide and carbon monoxide. The WHO (2021) issued new global air quality guidelines that recommend levels for key pollutants in outdoor and indoor air worldwide; they are not legally binding. These revisions were prompted by increasing evidence that air pollution harms health even at concentrations once considered acceptable. Knowledge of the causes of urban pollution and of what is effective in reducing it is crucial to foster healthy and sustainable urban development. The main causes of urban air pollution, its health impacts and findings from evidence-based solutions are presented in this study.
Causes of Urban Air Pollution
The burning of fossil fuels is one of the primary contributors to air pollution in cities. Vohra et al. (2021) estimated that outdoor fine particle pollution from fossil fuel combustion caused about 10.2 million premature deaths of people over 14 in 2012, about a fifth of all deaths in that age group, and 8.7 million once China’s cuts in pollution between 2012 and 2018 are taken into account. They estimated the highest burden in regions with the most fossil fuel pollution, with 3.9 million deaths in China and 2.5 million in India in 2012. These values reveal pollution from fuel combustion as one of the greatest threats to health worldwide.
There are a number of urban sources for this contribution. Road transport is a major one, with people directly exposed to NOx, PM and CO emissions from petrol and diesel-powered vehicles. Emissions are exacerbated by congestion, aging cars and poor engine maintenance. Sulphur dioxide, nitrogen oxides and fine particles are emitted from industrial plants or coal- and oil-fired power plants, sometimes near residential areas. Other sources are the burning of solid fuels for residential heating and cooking, open waste burning and dust from construction and demolition.
Urban air quality is also influenced by geography and the weather. In basin or valley cities, and under temperature inversions, pollutants can be confined near the surface for days. Where emissions have no limits or the limits are not enforced, high population growth and rapid urbanization boost energy demand and vehicle ownership, and emissions rise. Pollution is thus a product of energy systems, choices in transport, land use and governance, and as such no single measure is capable of solving the problem.
SourceRoad transportPetrol and diesel vehicles; worse with congestion, old cars and poor maintenance
What it releasesSourceIndustry and power plantsFactories and coal- and oil-fired power stations, sometimes next to homes
What it releasesSourceHome heating and cookingCoal, wood and other solid fuels burnt in stoves and open fires
What it releasesSourceOpen burningWaste burnt in the open
What it releases
What each pollutant does
- PM₂.₅Fine particles
Get deep into the lungs and can enter the bloodstream; linked to heart disease, stroke, lung cancer and respiratory disease.
WHO guideline: 5 µg/m³, annual mean
- NO₂Nitrogen dioxide
Irritates the airways and aggravates respiratory diseases such as asthma; helps form ozone.
WHO guideline: 10 µg/m³, annual mean
- SO₂Sulphur dioxide
Linked to hospital admissions and emergency visits for asthma.
WHO guideline: 40 µg/m³, 24-hour mean
- COCarbon monoxide
Passes from the lungs into the blood and keeps the body’s cells from getting enough oxygen.
WHO guideline: 4 mg/m³, 24-hour mean
Health and Social Impacts
Pollution in the air can have substantial and pervasive impacts on health. According to the Health Effects Institute (2024), air pollution as a whole, from outdoor and household fine particles and ozone, contributed to 8.1 million deaths in the world in 2021, which makes it the second leading risk factor for early death, after high blood pressure. This estimate covers all sources of air pollution and uses different methods, so it is not comparable with the fossil fuel figure above. The same report found that air pollution was linked to more than 700,000 deaths of children under five in 2021, most of them from household air pollution; exposure in the womb makes low birth weight and preterm birth more likely, and air pollution contributes to lower respiratory infections, the leading cause of death at this age. Exposure to air pollution is linked to stroke, ischemic heart disease, chronic obstructive pulmonary disease, lung cancer and the exacerbation of asthma, and it is associated with lower respiratory infections.
Exposure is also virtually ubiquitous. The WHO (2022) reports that almost the entire world population (99%) breathes air that exceeds the guideline levels set in 2021, and that more than 6,000 cities in 117 countries now monitor air quality. The exposures are highest among people in low- and middle-income countries. In cities, poor populations have been found to live in close proximity to highways, industrial zones, and other emission sources. Children, the elderly, and persons with pre-existing heart and lung diseases are at the highest risk. In addition to deaths, pollution leads to hospital admissions, lost productivity due to sickness and work absences and a significant burden on health systems. This is thus a social justice and environmental problem.
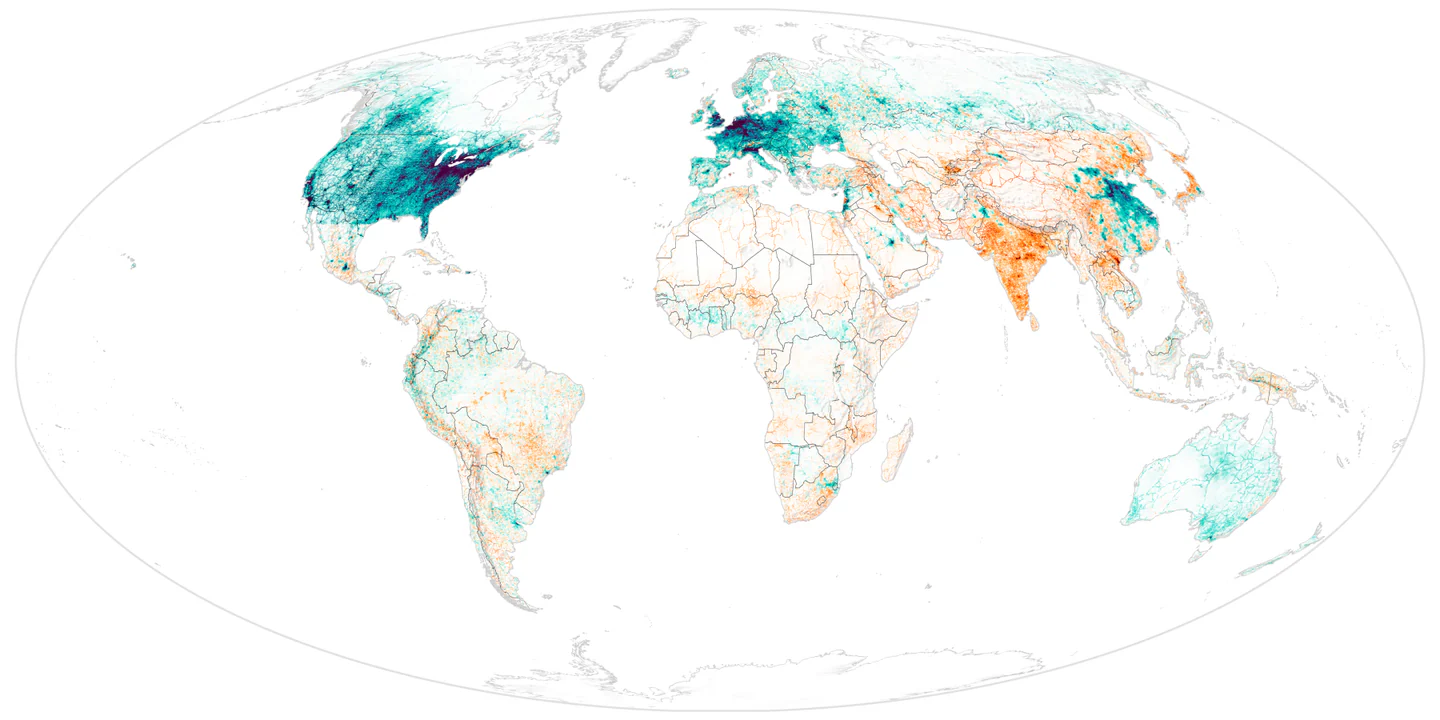
Change in annual NO₂ concentration, 2000–2019 (ppb)
Solutions
The first step to cleaner air is to adopt and implement evidence-based standards. The WHO (2021) guidelines provide a clear benchmark against which to measure improvements: a recommended annual mean level of 5 µg/m³ for PM₂.₅. The guidelines are not legally binding, but countries can use them to set their own standards. Health alerts can also be given based on real-time monitoring networks and an assessment of whether policies are achieving their aims.
There are several solutions that can be implemented starting with reducing emissions from transport. Efficient, affordable public transport like bus rapid transit, metro lines and trams can also be funded to reduce reliance on private cars. Protected walking and cycling facilities have a proven effect on cutting down short car trips. Electrifying the entire transportation sector, from buses, taxis and delivery fleets to private cars, eliminates tailpipe emissions, but how much it reduces pollution overall depends on how cleanly the electricity is generated. Low emission zones and congestion charging discourage the presence of the most polluting vehicles in the central areas of the city, while tougher inspection and fuel quality standards reduce the number of vehicles emitting high levels of pollution.
Changing the energy system is also crucial as fossil fuel combustion is a major source of harmful fine particles (Vohra et al., 2021). The integration of wind and solar power generation, along with other combustion-free sources such as hydro and geothermal power, diminishes air pollutants and reduces greenhouse gas emissions, accompanied by health and climate benefits. In addition, filters and scrubbers should be installed, as well as cleaner fuels and better energy efficiency in industrial installations. In households, clean cooking and heating in place of solid fuels lowers both indoor and outdoor pollution, and better insulation reduces the fuel needed for heating.
Urban planning provides longer-term solutions: compact, mixed-use neighborhoods shorten distances and make walking, cycling and public transport more convenient. Green infrastructure, such as urban trees, parks and green roofs, plays a complementary role and may help to catch some of the particles, and to reduce local temperatures, but should not be used as an alternative to reducing emissions. Other local measures include improved waste management, which will eliminate open burning, and dust control at construction sites.
SourceRoad traffic
Measure- Bus rapid transit, metro lines and trams
- Protected walking and cycling routes
- Low emission zones and congestion charging
- Inspection and fuel quality standards
Expected effectLowerFewer and cleaner vehicles: less NO₂, PM₂.₅ and CO along busy roads.
SourcePetrol and diesel engines
Measure- Electric buses, taxis, delivery fleets and cars
Expected effectDependsNo exhaust on the street, but brakes, tyres and roads still shed particles, and power stations emit unless the electricity is clean.
SourcePower plants and industry
Measure- Wind, solar, hydro and geothermal power
- Filters and scrubbers
- Cleaner fuels and energy efficiency
Expected effectLowerLess SO₂, NO₂ and PM₂.₅ from smokestacks.
SourceSolid fuels in homes
Measure- Clean cooking and heating
- Better insulation
Expected effectLowerLess PM₂.₅ and CO indoors and in the streets around.
SourceOpen burning and building sites
Measure- Waste collection instead of open burning
- Dust control on construction sites
Expected effectLowerLess smoke and dust in the neighbourhood.
SourcePollution already in the air
Measure- Urban trees, parks and green roofs
Expected effectSmall, localCan catch some particles and cool streets nearby, but does not replace cutting emissions at the source.
National and city-level policies and decision-making frameworks need to be clear, and funding and collaboration between sectors (e.g., health, transport, energy, planning) are needed because air pollution transcends administrative boundaries. Public education and easy-to-understand air quality information empower the public to minimize their own exposure and help to drive more effective policies. As the Health Effects Institute (2024) illustrates, inaction carries a massive toll, while sustained policies and technologies have already improved air quality and saved lives in some areas.
Conclusion
Urban air pollution is primarily caused by fossil fuel combustion in traffic, industries, power generation and domestic residences and made worse by fast urbanization and local climatic conditions. It contributes to millions of deaths every year, of children as well as adults, and almost everyone breathes air above the guideline levels recommended by the World Health Organization. However, the answers are not so elusive. With robust air quality regulations, improved modes of transport, renewable energy options, smart urban planning and public engagement, emissions and loss of life could be reduced. Those cities that take action will reap healthier populations, reduced health care expenses, and healthier living environments.